Metric System Index

Metric System Index

RACS

RACS

RACS measures how much complexity remains after accounting for repetition pressure, vocabulary strength, and lexical narrowness.

RACS measures how much complexity remains after accounting for repetition pressure, vocabulary strength, and lexical narrowness.

Repetition-adjusted complexity: reads how much structure remains after repeated patterns and narrow vocabulary are discounted.

Repetition-adjusted complexity: reads how much structure remains after repeated patterns and narrow vocabulary are discounted.

Formula

Formula

Mean: average of entropy family, lexical core, and repetition control. Efficiency: average of RACS Mean and RACS Balance.

Mean: average of entropy family, lexical core, and repetition control. Efficiency: average of RACS Mean and RACS Balance.

Families: Shannon/Rényi/Tsallis entropy, lexical core, and repetition control.

Families: Shannon/Rényi/Tsallis entropy, lexical core, and repetition control.

What It Means

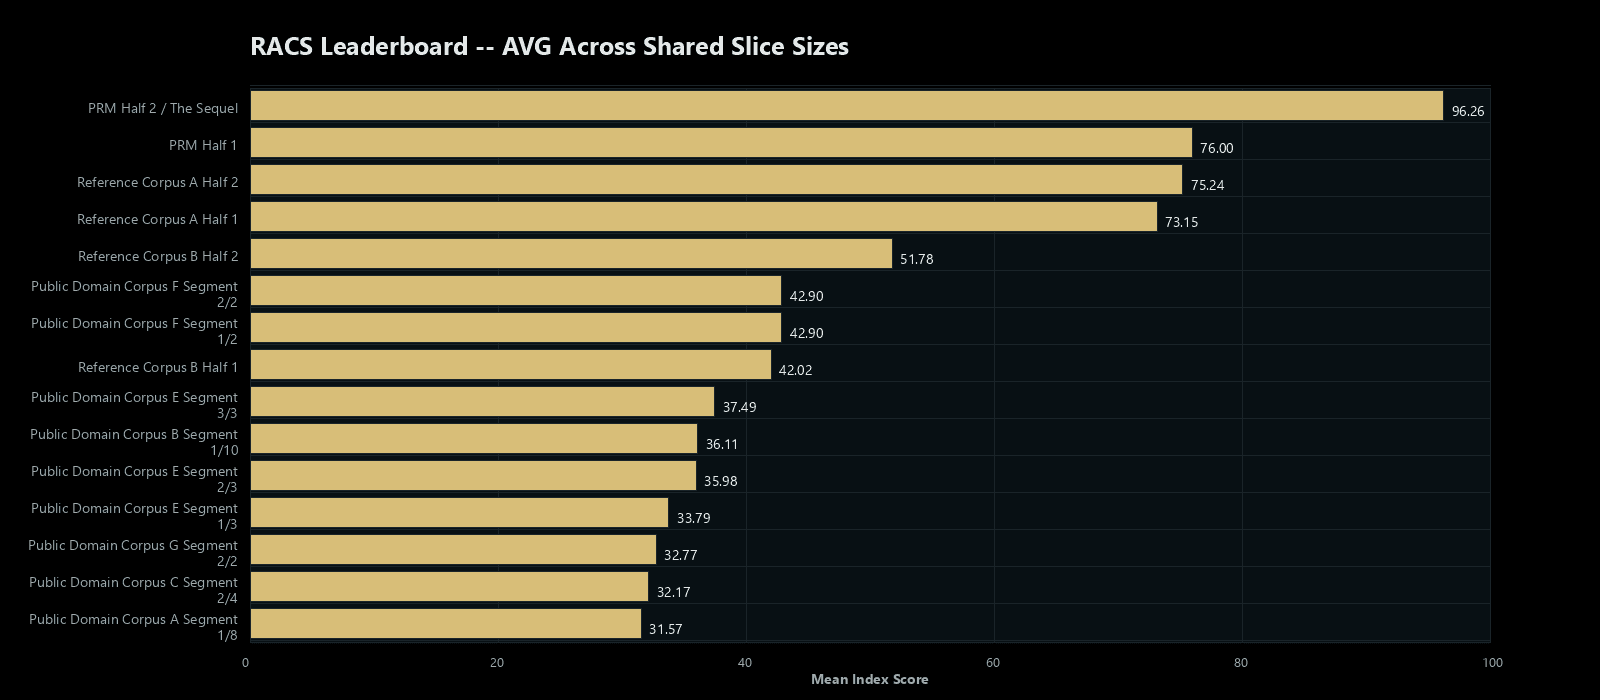
RACS tests clean complexity. It asks whether the complexity is supported across multiple metric families, rather than being carried by one number.

Scoring Context

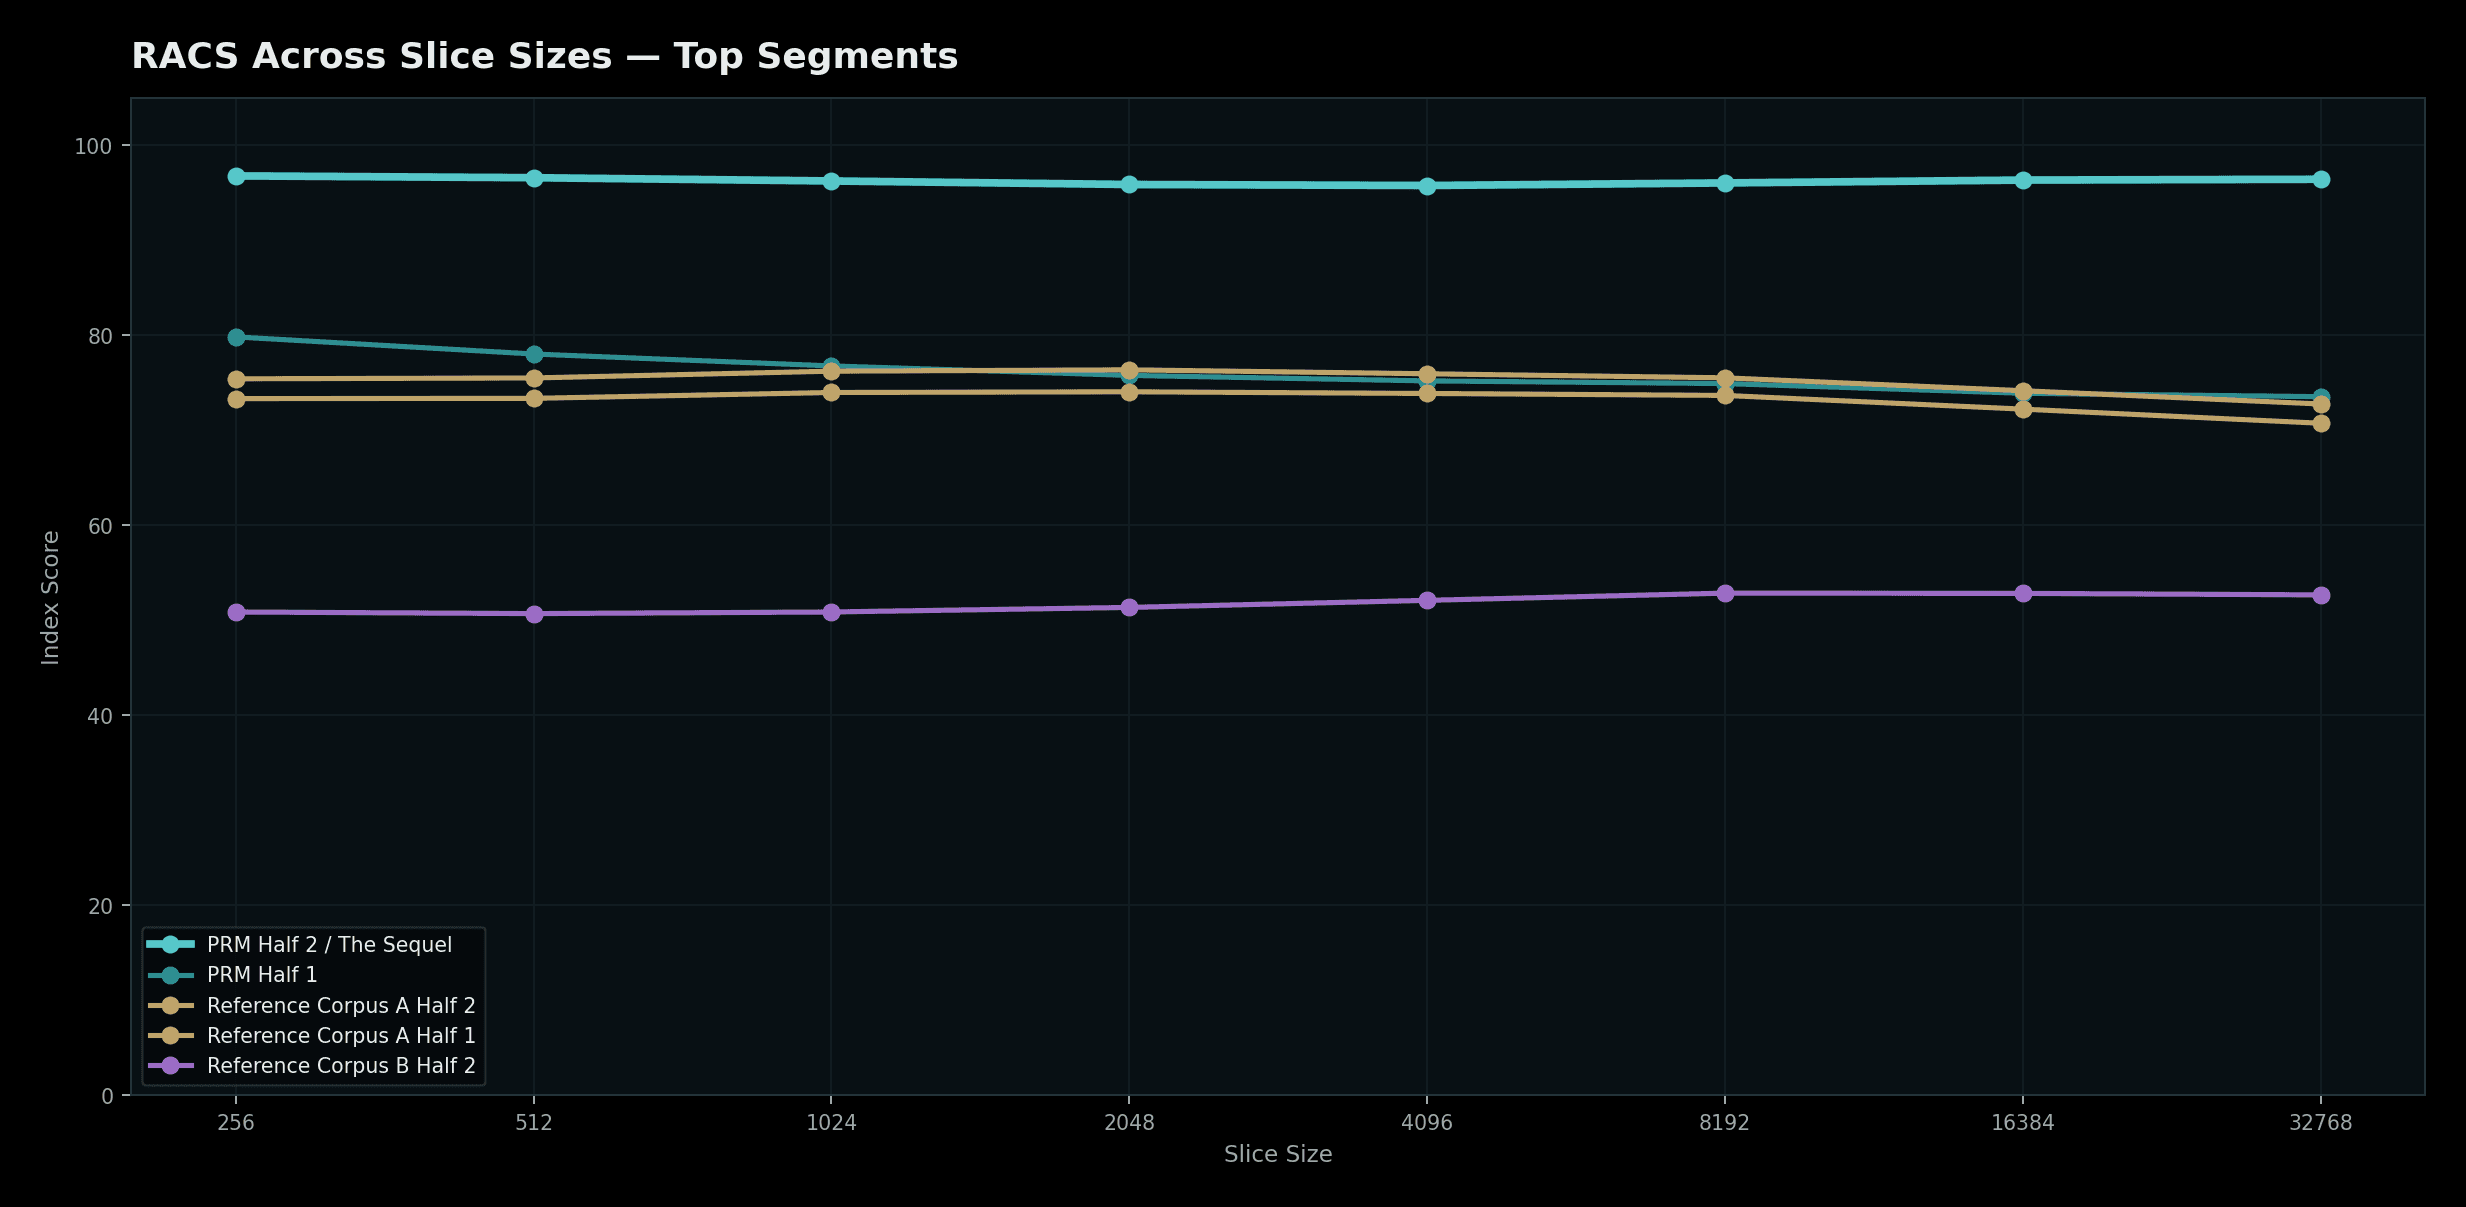
Scores are standardized within the declared comparison pool, tokenizer, transform, and slice-size run before index calculation. Index values are therefore run-context-specific and should not be interpreted outside the stated configuration.

Evidence Boundary

The public RACS page describes aggregate metric behavior. It does not publish protected corpus text, third-party lyrics, artist names, album titles, song titles, or source-reconstructable mappings.

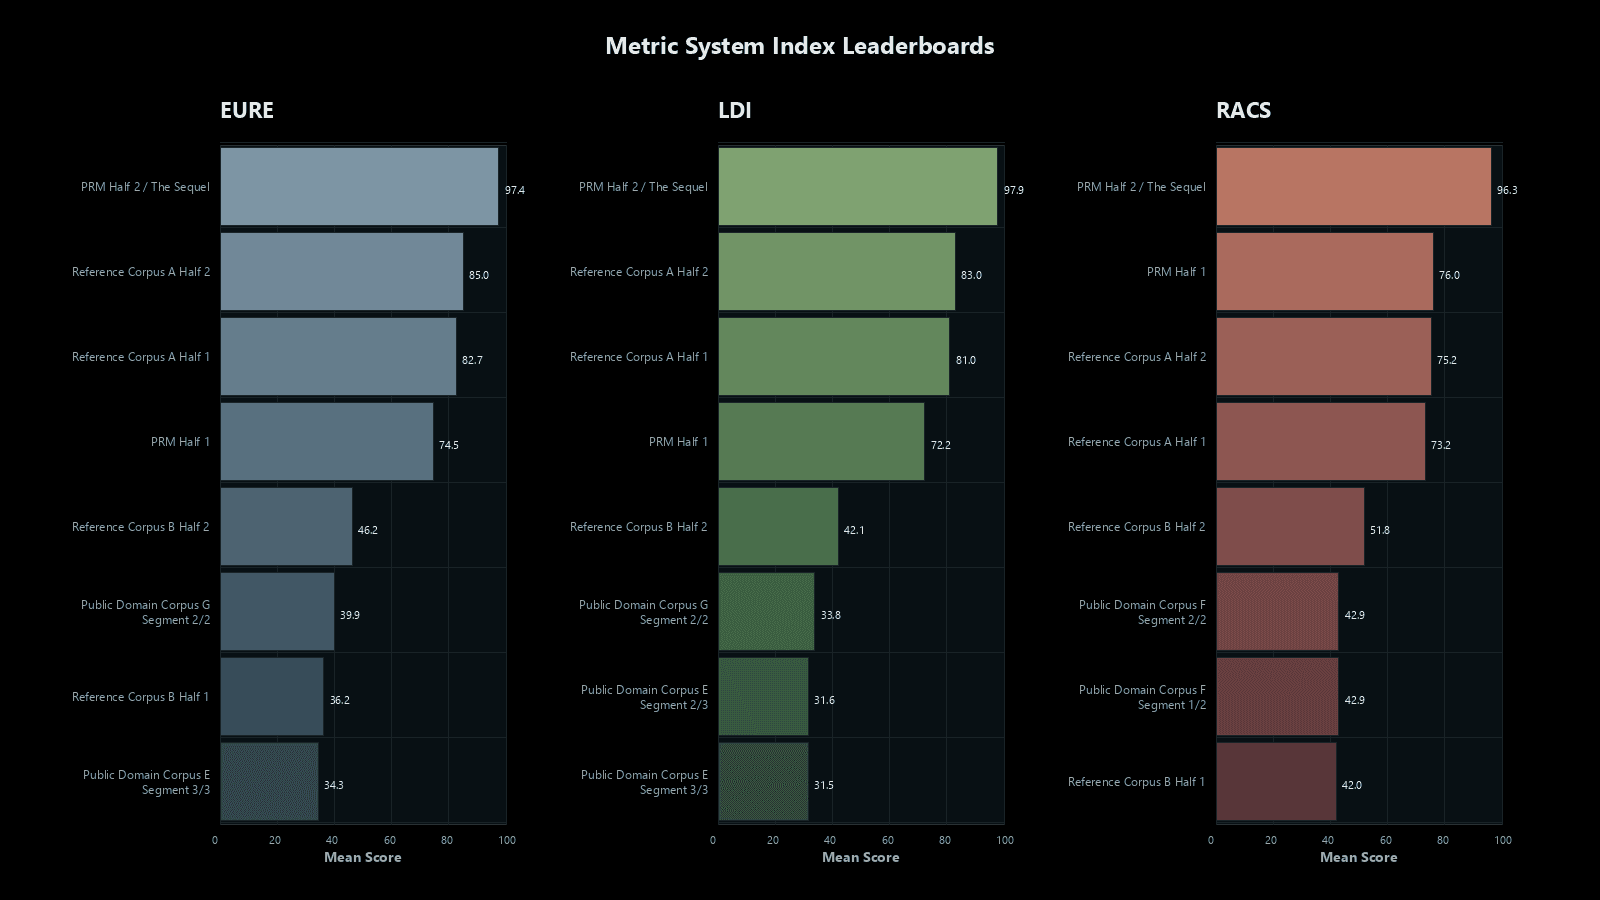
This page supports a metric-specific aggregate claim: RACS can show whether complexity remains coordinated after entropy behavior, lexical-core behavior, and repetition control are read together. It does not publish source text, identify protected reference material, or prove universal artistic ranking. The public result is strongest inside the tested comparison pool, and deeper source-level verification belongs in controlled review.

Evidence Charts

Evidence Charts

Start with the RACS leaderboard to see the direct clean-complexity ranking. Then use the slice-size trend to check whether the result survives different measurement windows.

Start with the RACS leaderboard to see the direct clean-complexity ranking. Then use the slice-size trend to check whether the result survives different measurement windows.

RACS leaderboard

RACS leaderboard

Ranks the tested segments by RACS, the repetition-adjusted complexity lens.

Ranks the tested segments by RACS, the repetition-adjusted complexity lens.

RACS slice-size trend across top segments

RACS slice-size trend across top segments

Tracks RACS across slice sizes for the top segments.

Tracks RACS across slice sizes for the top segments.

EURE / LDI / RACS leaderboard comparison

EURE / LDI / RACS leaderboard comparison

Compares EURE, LDI, and RACS without merging the three lenses.

Compares EURE, LDI, and RACS without merging the three lenses.

Reference Comparison Boundary

Reference comparisons are baseline coordinates for interpreting metric behavior. They are not presented as artistic rankings or claims of superiority over other writers.